MapleSim in Engineering Education

Keywords: Intermediate axis theorem, Tennis racket theorem, Dzhanibekov effect, Coriolis force, Euler equations

In 1988 I witnesses the instability of the rotation about the intermediate axis of a foam brick.
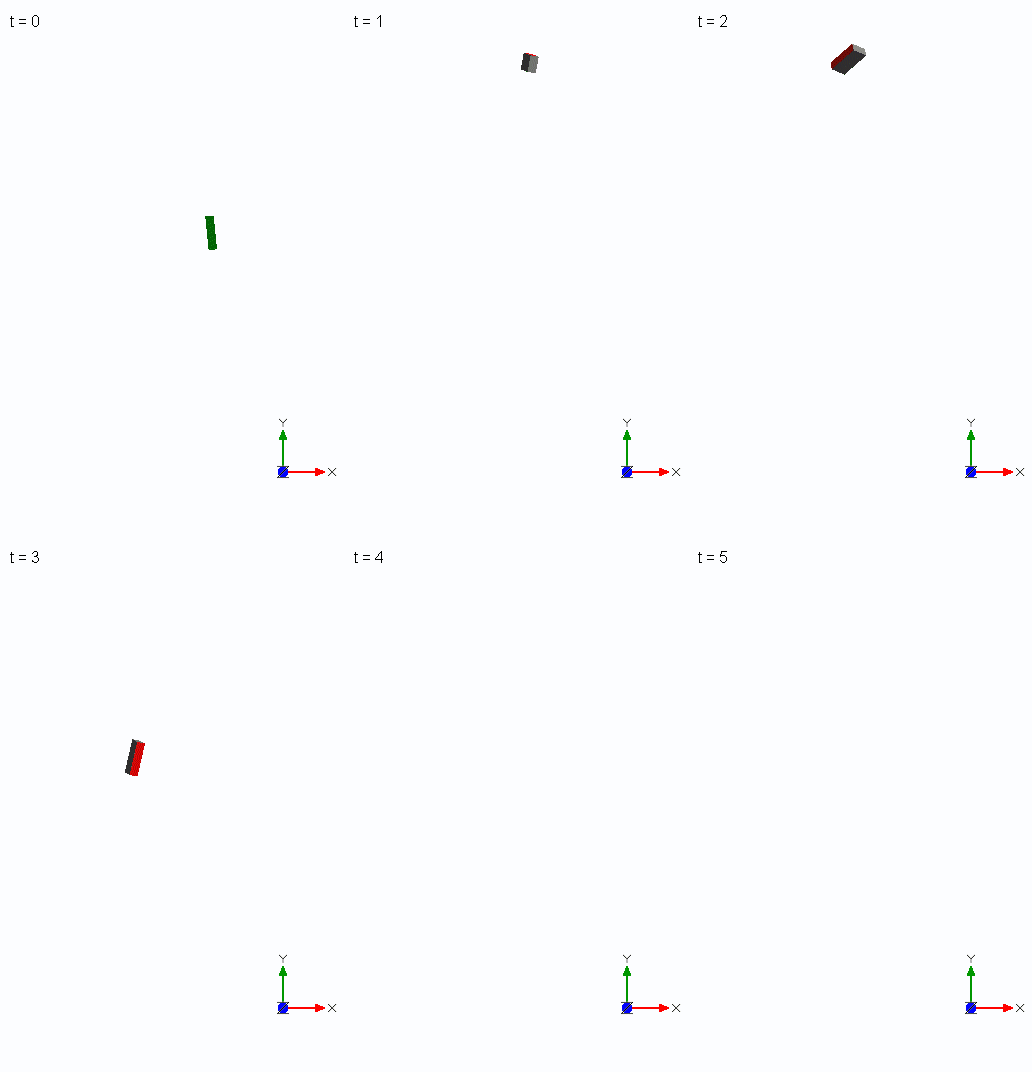
Since then I have been fascinated by this effect. It was one of the many experiments which enriched a lecture series on kinetics and on that day Euler equations were on the agenda. Colored surfaces of the brick made it possible to observe the effect without micro gravity and slow-motion equipment.

This post is about reproducing an “intuitive” visualization of an explanation of the effect by Terry Tao from 2011 using 4 rigidly connected point masses. 8 years later the explanation was animated in a YouTube video (The Bizarre Behavior of Rotating Bodies) and considered to be the “best intuitive” explanation.

Motivated by the video, I wondered whether a similar animation with acting forces is possible with MapleSoft products and whether there might be a better intuitive explanation without the use of centrifugal forces. Initially I saw this more as a good test of MapleSim’s visualization capabilities. Finally, it took over 3 years and numerous attempts (mostly during vacation, kind of a substitute for drawing circles in the sand...) to come to a conclusion on the effect.
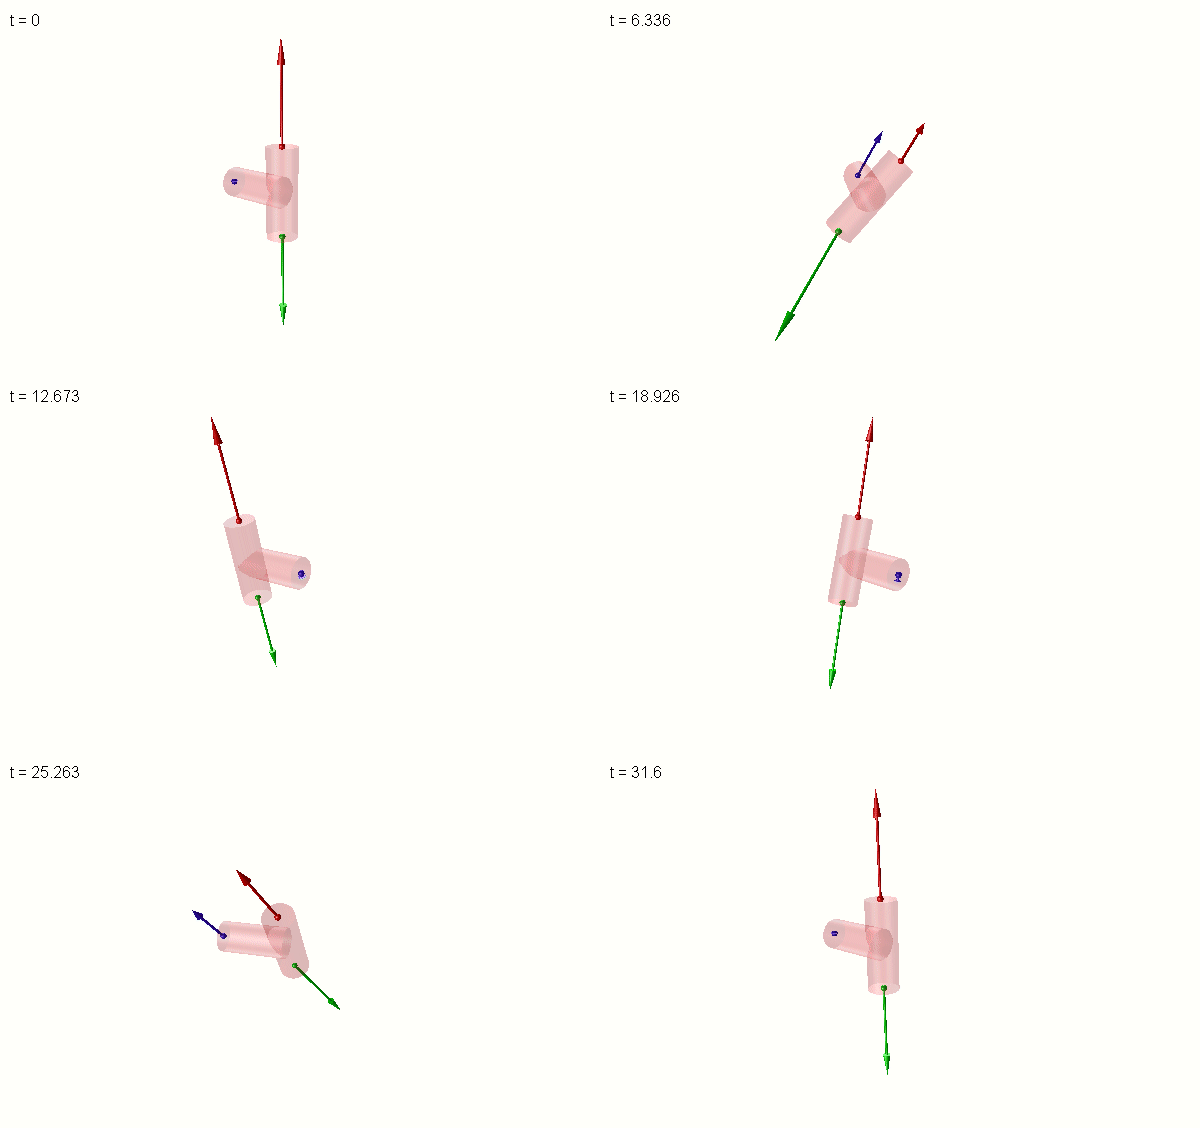
Intermediate_axis_theoreme_with_3_point_masses.msim


About the model:

Unlike the YouTube video, I decided to simulate 3 identical point masses because a 3-mass model fits better to a T-handle (overlayed in the animation above), video footage from space experiments and discussions in this forum (221298, 225760, 228066).

The movement of the model generates acceleration forces on each mass. The clip displays the corresponding opposing forces that act in the model (i.e. act on the massless T-structure). The blue mass, which is not perfectly centered on the axis of rotation at the start of the simulation perturbs the orbits of the red and the green masses. That was my initial intuitive attempt to explain the effect.

The 3 masses form an isosceles triangle. Here it is helpful to think of a rotating arrowhead where the shape determines stability of the rotation. The aspect ratio (the ratio of the height to the base length) of the triangle determines the stability of rotation about the mirror symmetry axis of the triangle (i.e. the symmetry axis of the T-structure). An obtuse triangle (“blunt”, aspect ratio < sqrt(3)/2) is unstable when rotating about an axis that is slightly inclined with respect to this axis of symmetry. The inclination can be in the plane of the triangle or out of plane. An acute (“pointy”) triangle only wobbles.

About the MapleSim model:

A supplementary rigid body component without mass and rotational inertia is used at the center of mass of the three masses to impose initial conditions. Rotating the triangle at the start of the simulation about the center of mass of the 3 masses prevents the triangle from drifting laterally away from its initial position. This effect of lateral drift is visible in video footage from space with the T-handle.

The rotational inertia of the other rigid body components is set to zero. Without rotational inertia it could be assumed that only Newtonian mechanics are used in the simulation (i.e. no Euler equations are integrated). This is however wrong. MapleSim generates automatically from a system with 3x6=18 coordinates a system with 3 Newtonian equations for translation and 3 Euler equations for rotation.

Forces and moments are measured with sensor components. Visualization is done with force and moment visualization components. These components are “abused” to display the following other physical quantities:

The angular momentum of the masses

The vectors of the angular velocity and the angular acceleration

Moments of the forces with respect to the center of mass

Moments of the forces with respect to the center of the base of the triangle

For a clean model, sensor components and mathematical components to calculate physical quantities are grouped in three subsystems (one per mass, indicated with a colored dot in the image below).

The model contains parameter sets for in plane and out of plane inclination of the axis of the T with respect to the initial axis of rotation (the x-axis).

Ein Bild, das Diagramm, Text, Screenshot, Plan enthält.

Automatisch generierte Beschreibung 

Visualization of physical components can be turned on by enabling the corresponding subsystems which are labeled accordingly (in the image above the display of the angular momentum is enabled). The subsystem “Verification” computes quantities that should either be conserved or should be equal to zero.  Calculation of quantities is done with MapleSim’s mathematical components (i.e. no embedded code or custom components are used).


Some observations

Kinetic energies are exchanged between the masses.  During a flip of the T (see animation above), the red and green masses “exchange” their energy. The blue mass mediates this exchange.  Depending on the initial conditions (in plane or out of plane), the energy of the red mass decreases first during the flip and the energy of the green mass increases (and vice versa, as seen below for the out of plane case which exhibits symmetric energy distributions).

Energy peaks are a good measure for the flip frequency. The frequency increases with the initial misalignment of the rotation axis to the symmetry axis of the T.

Ein Bild, das Text, Reihe, Diagramm, parallel enthält.

Automatisch generierte Beschreibung 

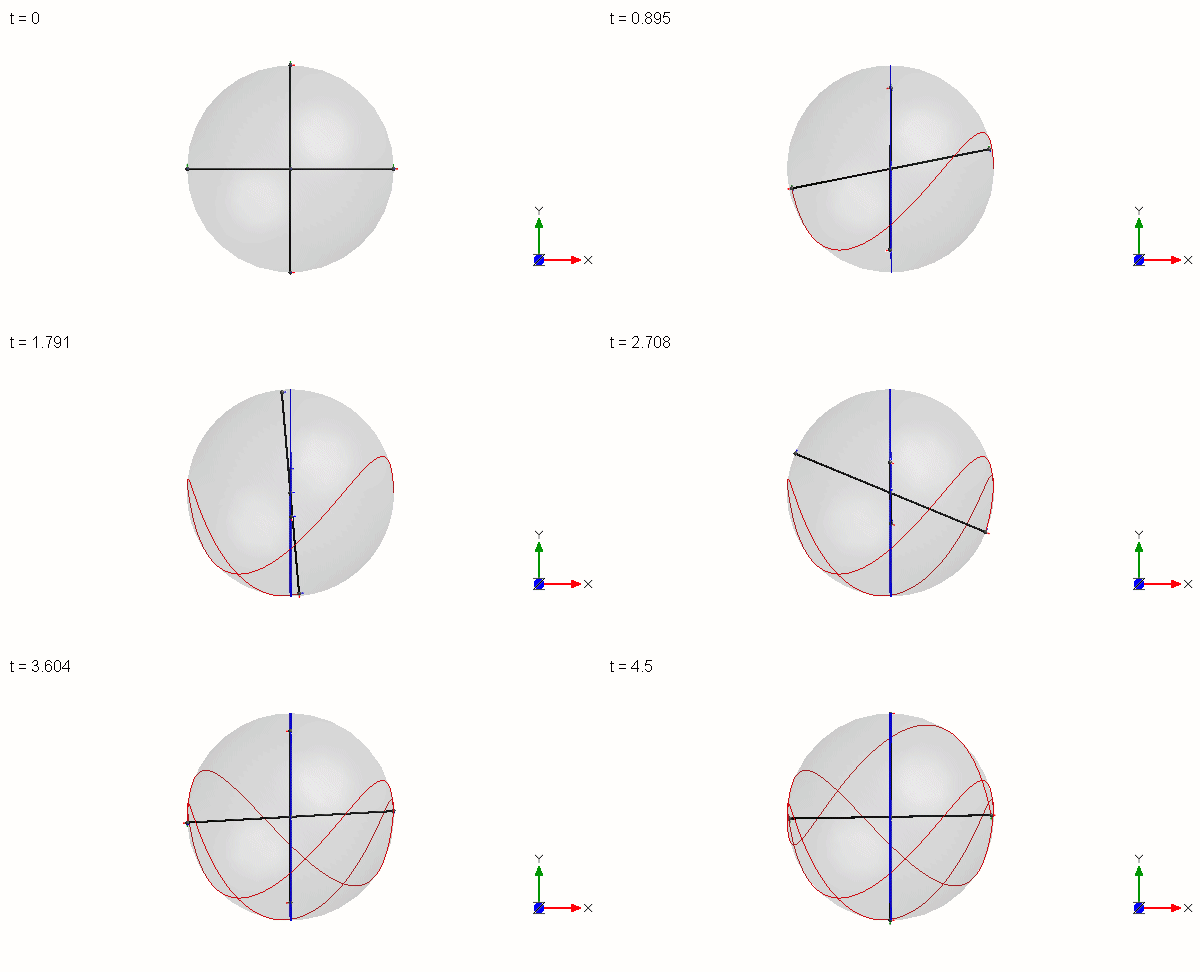
Tracing the blue perturbing mass reveals that the mass never gets closer to the (initial) rotation axis than its initial off-axis position.

Ein Bild, das Zeichnung, Kreis, Entwurf, Kunst enthält.

Automatisch generierte Beschreibung

The angular momenta of the masses vary, but the total angular momentum is, as expected, conserved. In the image below the angular momenta of the three masses are visualized to the left. The change of kinetic energy can be appreciated from the change in magnitude of the angular momenta.
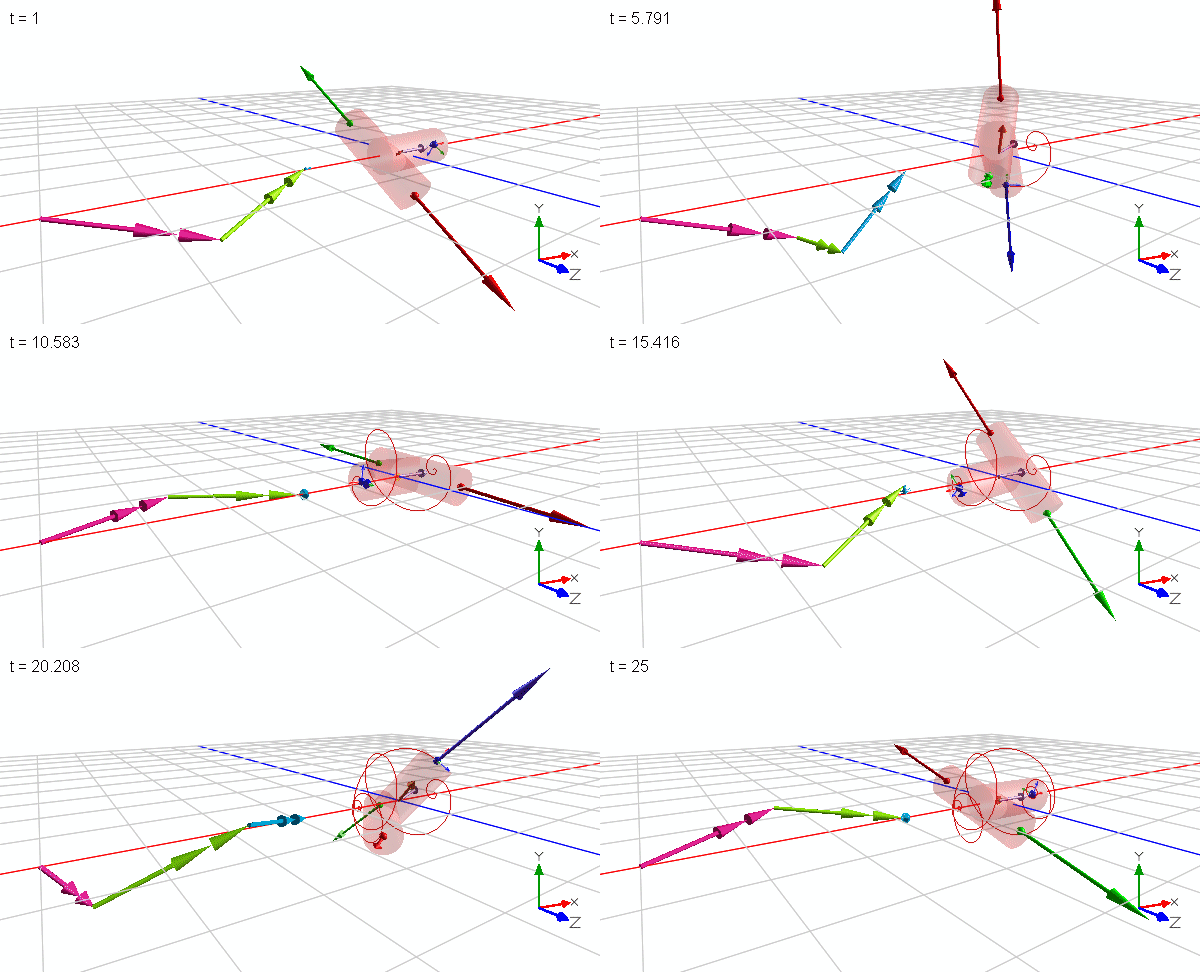
The vector of the angular velocity (violet, at the origin) wobbles during the flip but does not flip direction. The vector of the angular acceleration (orange) rotates in the yz-plane

Forces act in the plane of the triangle. There is no component normal to the plane, as in the YouTube video, that could cause a flip. Thus, the displayed forces measured in the inertial reference frame do not provide an intuitive explanation why the flip occurs.

The same applies for the moments of the forces at the center of mass: They are perfectly balanced. There is no net component that could be attributed to an in-plane rotation.


Why are the animations different: Apparent vs. internal reactive forces.

The MapleSim animation shows internal reactive forces that illustrate the interplay of the moving masses which are bound to each other. They act in the model and obey actio = reactio, which means that the same vectors of opposite sign pull on the masses when the masses are isolated (they follow Newtons second law and equate to mass times the vector of acceleration; the last image in this post displays an isolated mass and the opposing force). 

On the contrary, the YouTube animation shows apparent forces (centrifugal forces) that appear when accelerations are described in a reference frame that moves (accelerates or rotates) with respect to the inertial reference frame. They look like external forces acting on the model, but they are not real. Since apparent forces are fictitious (not real), not everyone is satisfied with using them for an intuitive explanation.


Can the MapleSim animation be improved?

Calculation of apparent forces is possible but less straight forward for the simple reason that the Mathematical components library does not provide operators for coordinate transform and matrix multiplication. Those operators are normally not required for simulation purposes. (It would be interesting to see how calcualtion of apparent forces can be done in MapleSim. Verification of code implementation might not be as easy as in the inertial reference frame.)

What ultimately prevents a reproduction of the video is the observer/camera view that rotates with the model. This feature does not exist in the current version of MapleSim 2024. To reproduce the video, Maple has to be used. This would also make the implementation of the calculation of apparent forces much easier as compared to, for example, Modelica code implementation (at least for me).


Is the 3-mass model equally intuitive as a 4-mass model?

The initial idea was to have two orbiting masses that are perturbed by a third mass. The third mass flips like a pointer back and forth while the two masses still follow their orbit. This is in case of 3 identical masses only possible with a short-legged T as shown here:
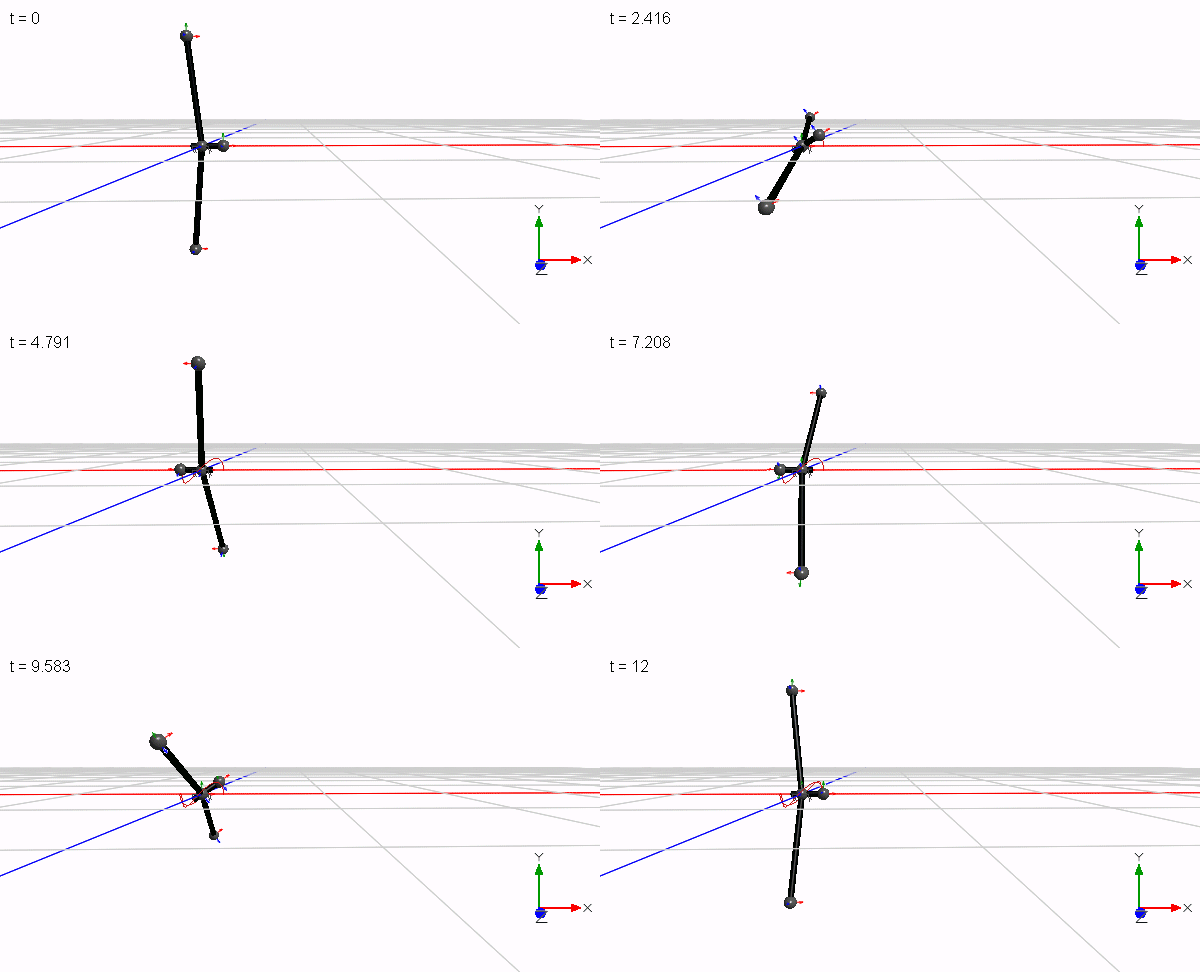
Only a reduced mass would allow for a longer leg. Since the T has only one axis of symmetry, the two orbiting masses do not orbit in a plane. They perform a wobbling motion and shift laterally in position during a flip since the rotation is performed about the common center of mass. Only when 4 masses are used in a symmetrical cross configuration, two masses can orbit closer to a plane that contains the common center of mass while the two perturbing masses flip sides of the plane (the wobble is less pronounced but still visible by the enlarging blue trace in the animation below).

With a mass ratio of 1:100 in the animation below the two orbiting masses create kind of a centrifugal potential field in which the two perturbing masses swing like a pendulum. In this configuration the two perturbing masses can no longer be regarded as strongly disturbing, but rather as oscillating satellites. The sudden flip is created by the increasing accelerating field strength which increases with the distance from the axis of rotation. This lets a pendulum swing with a stronger than expected acceleration and is perhaps a new insight.
Both models represent the simplest possible implementation to generate the effect in terms of number of parameters. The 4-mass configuration has more objects but is simpler to understand because of the higher degree of symmetry.  Either identical masses at varying distances or identical distances at varying masses can be used in both models. No more reduction of parameters is possible to generate the effect. A two mass object cannot even wobble.

Out of plane initial inclination makes the acceptance of an explanation easier since the orbiting masses do not generate a momentum as in the case of an in plane inclination. For the latter case an intuitve explanation is more difficult and perhaps there is none.

Although the pendulum swing of the out of plane case might provide an intuitive explanation of the effect it is not fully satisfying. It does not explain why larger masses than the orbiting masses do not lead to a swing but smaller masses do. Another well-made video provides an explanation for that.

This newer video also gives an explanation why internal forces must act in the plane of the rotating object but does not display them in the animation. I guess this is because the introduction of real forces would have spoiled the intuitive explanation of the video. Isolating a mass and adding an internal force now as an external force leads to an equivalent system that reproduces the effect of the rotating object. If the same force is applied in the opposite direction on the isolated mass, the isolated mass moves along the same trajectory.

4_lumped_masses_and_one_single_force_driven_mass.msim

Isolating only one mass breakes the symmetry of the model. It also gives the false impression that the introduced perturbing force acts primarily on the opposite mass. A 3-mass model does not lead to such a false interpretation. By isolating the opposite mass and introducing a second perturbing force, the discussion shifts more to the analysis of the wobble and the rotational acceleration of the orbiting masses and less to the flip.

In summary, internal forces describe how the masses interact but their orientation is counterintuitively perpendicular to direction of the flip. On the other hand, centrifugal forces that we intuitively assume acting in a 4-mass model from the perspective of an observer from an inertial reference frame do not exist. This assumption provides an intuitive explanation which is physically wrong. In the same way an accelerating radial force field does not exist. Mathematically and physically correct is a description from a rotating observer which uses fictious forces.

For me both intuitive explanations of the videos are somehow useable, but both involve centrifugal forces (in one case explicitly and in the other wrongly assumed by an observer). This is not satisfying when the goal is not to use fictious forces.

Conclusion

MapleSim visualization components can be used for more than displaying forces and moments. They are very helpful to better understand physical phenomena.

A camera view observer on a rotating reference frame would have made observation of the direction of the internal forces much easier and might have given more insights. As of now, Maple is required to reproduce the animation in the video.

There is no better intuitive visualization/explanation with a model of 3 identical masses. A 4-mass configuration provides better insight but does not explain all.

In reality every freely rotating object with more than two point masses inevitably wobbles.

This post is about the visualization of a gyroscopic phenomenon of a rotating body. MapleSim models and a description for those who do not have MapleSim are provided for their own analysis. Implementation with other tools like Maple might give further insight into the phenomenon.

With appropriate initial conditions, a ball thrown into a tube can pop out of the tube. This can be reproduced with a MapleSim model

Throwing_a_ball_into_a_tube_A.msim

To hit a perfect shot without trial and error, time reversal was applied for the model (reversed calculation results of a ball exiting the tube are used as initial conditions for the shot). This worked straight away and shows that this model is sufficiently conservative.

This phenomenon has recently attracted attention on YouTube. For example, Steve Mold demonstrates the effect and provides an intuitive explanation which he considers incomplete because the resulting vertical oscillation of the ball does not match theory and his experiments. He suspects that the assumption of a constant axis of rotation of the ball is responsible for this discrepancy.

However, he cannot demonstrate a change of the axis of rotation. In general, the visualization of the rotation axis of a ball is difficult to achieve in an experiment. On the contrary, visualization is much easier in a simulation experiment with this model:

Throwing_a_ball_into_a_tube_B.msim

The following can be observed for a trajectroy that does not exit the tube:

At the apex (the top) of the trajectory, the vector of rotation (red bold in the following images) points downwards and is essentially parallel to the axis of the cylinder. The graph to the left shows the vertical (in green) position and one horizontal position (in red). The model applies gravity in negative y direction.

Ein Bild, das Text, Diagramm, Screenshot, Reihe enthält.

Automatisch generierte Beschreibung 

On the way down, the axis of rotation points away from the direction of travel (the ball orbits counterclockwise in the top view).

Ein Bild, das Text, Diagramm, Screenshot, Reihe enthält.

Automatisch generierte Beschreibung

At the bottom, the vector of rotation points towards the axis of the cylinder.

Ein Bild, das Text, Diagramm, Screenshot, Reihe enthält.

Automatisch generierte Beschreibung

On the way up, the axis of rotation points in the direction of travel.

Ein Bild, das Text, Diagramm, Screenshot, Reihe enthält.

Automatisch generierte Beschreibung

These observations confirm that the assumption of a constant axis of rotation is too simplified. Effectively the ball performs a precession movement know from gyroscopes. More specifically, the precession movement of the rotation axis rotates in the opposite direction of the rotation of the ball.

However, the knowledge and the visualization of this precession movement do not provide more insight for a better intuitive explanation of the effect. As the ball acts like a gyroscope, a second attempt is to visualize forces that perturb the motion of the ball. Besides gravity, there are contact forces exerted by the tube. The normal force at the contact as well as the gravitational force cannot generate a perturbing momentum since they point to the center of the ball. Only frictional forces at the contact can cause a perturbing momentum.

Contrary to the visualization of the axis of rotation, visualization of contact forces is not straight forward in MapleSim, because neither the contact point nor the contact forces are directly provided by components of the MapleSim library. Only for a single contact point, a work-around is possible by measuring the reactive forces on the tube and then displaying these forces in a moving reference frame at the contact point. The location and the orientation of this frame are calculated with built-in mathematical components. To illustrate the additional effort, the image below highlights in yellow the components only needed for the visualization of the above images, all other components were required to visualize the contact forces and frictional moments.
Ein Bild, das Text, Diagramm, Plan, parallel enthält.

Automatisch generierte Beschreibung
Throwing_a_ball_into_a_tube_C3.msim
It required many attempts to get to a working model. Several kinematic models for a rotating reference frame at the contact point failed. Finally, mathematical operations on kinematic signals (measured by sensors) and motion drivers were successful.  

In the following, the model is used to visualize the right-hand rule for the following vectors:

  • in green the disturbing frictional moment
  • in red (now with a double headed arrow) the angular velocity (for a sphere it points in the same direction as the vector of the angular momentum and the axis of rotation)
  • in pink the vector of the angular velocity of the precession movement

At the top, the vector of precession indicates that the axis of rotation is diverted away from the direction of travel (i.e. pointing backwards). This is in line with the above image of the ball “on the way down”.

Ein Bild, das Screenshot, Text, Diagramm, Reihe enthält.

Automatisch generierte Beschreibung

At the bottom, the vector of precession indicates also that the axis of rotation is diverted away from the direction of travel. This however cannot be seen in the above image of the ball “on the way up”. This discrepancy is an indication that the vector of angular velocity of the precession movement might not sufficiently predict the future orientation of the axis of rotation.

Overall, there is little symmetry in the two extreme positions at the top and at the bottom. A bending of the trajectory downwards (pitching down) at the top indicated by the vector of precession, cannot be seen at the bottom: The vector of precession does not indicate a bending of the trajectory in an upward direction.

It turns out that the right-hand rule does not provide the hoped-for better explanation either. However, the model was not a complete waste of time since it provided two unexpected and very counterintuitive observations:

  • At the bottom, the speed of the balls center is the lowest. For an object descending in a gravitational field, one would expect a gain in speed. A closer look at the graph of the angular velocity (lower graph) reveals that the ball is spinning at the highest rate at the bottom. This means that potential and kinetic energy at the top are converted to rotational energy at the bottom.
  • Although the ball slows down (and speeds up in angular velocity) while descending there is no frictional force component in circumferential direction. Seen from above, the ball orbits at constant velocity. Only a vertical frictional force component acts all the time. Frictional forces in circumferential direction slowing down the ball can only be seen at the beginning of the simulation when the ball slips on the tube up to the moment when it rolls without slippage.

Overall, the closer one looks, the less intuitive it gets. What makes this phenomenon so difficult to understand is the constantly changing constraint of the ball. At each time increment the location and orientation of the contact changes with respect to the direction of the (instantaneous) direction of precession. This makes the phenomenon so obscure. It might be easier to find an “intuitive” explanation for the tennis racket paradox (or intermediate axis theorem) where no external forces act.

Even with a physics background and the right-hand rule of precession at hand, it requires allot of imagination to predict the movement of the ball. This is, in my opinion, not intuitive at all for most people. After all, the premotor cortex of the human brain seems to have constant difficulties to learn precession – for sure precession prediction is not hardwired. If it was, the paradox wasn’t so perplexing, and we could imagine/predict what the golf ball does next.

In summary, this simulation experiment revealed details not known before (at least to me) about the phenomenon. The experiment did not provide more insight for a better intuitive explanation but on the contrary raised more questions. It is another case of “knowing more, but not getting smarter”.

At the very least, the simulations also show the benefits of carrying out virtual experiments under various conditions that are difficult or even impossible in an experiment. In any case, such experiments are of educational value  - not only in classical physics.


Comments on the product:

It was possible to verify results of MapleSim: The model reproduces the magic numbers sqrt(7/2) and sqrt(5/2) for the ratios of circular rotation and vertical oscillation frequencies for a full and a hollow sphere respectively. See the first model.

The (laborious) work-around presented here cannot be applied to most real-world contact problems. Visualization of the contact point, contact forces and contact slippage are therefore a desirable extension to MapleSim’s contact capabilities. I do not think that this is provided by other tools.

A surface pattern for the ball would have been helpful to better visualize the rotation of the ball.

A moving observer view (in this case an observer in the reference frame of the contact) could facilitate observation.

Further viewing:

  • The physical engine of Blender was used in a video to reproduce the phenomenon qualitatively.
  • There is an ”improved” intuitive explanation of Steve Mold’s explanation which uses frictional forces and provides physical background. It is not clear to me which part of the visualization is animated and which is physically simulated. At least some sequences do not make sense: The vector of the external frictional moment on the ball suddenly changes direction. The “improved” intuitive explanation also states that the rotational axis leans constantly toward the contact point. I do not see this in my simulation (the contact point is indicated with a red dot in the images above). Also, the precession vectors in my simulation did not reveal an intuitive explanation for a reduction in vertical oscillation frequency.

Further work:

  • Is the vertical oscillation truly sinusoidal as the horizontals are?
  • Is the point of contact always in the northern hemisphere of the ball? More general: In one hemisphere?
  • In a simulation without gravity: Does the vector of precession better predict the trajectory?
  • ...
     

This is a reminder that presentation applications for the Maple Conference are due July 17, 2024.

The conference is a a free virtual event and will be held on October 24 and 25, 2024.

We are inviting submissions of presentation proposals on a range of topics related to Maple, including Maple in education, algorithms and software, and applications. We also encourage submission of proposals related to Maple Learn. You can find more information about the themes of the conference and how to submit a presentation proposal at the Call for Participation page.

I encourage all of you here in the Maple Primes community to consider joining us for this event, whether as a presenter or an attendee!

Kaska Kowalska
Contributed Program Co-Chair

Explorer 1 was the first satellite sent into space by the United States. It was a scientific instrument that led to the discovery of the Van Allen radiation belt. In order to keep its orientation, the satellite was spin stabilized. Unexpectedly, shortly after launch, Explorer 1 flipped the axis of rotation. The animation below shows, on the left, Explorer 1 in its initial state after launch, rotating about the axis of minimum moment of inertia. On the right side, 100 minutes later in the simulation, Explorer 1 rotates about the axis of maximum moment of inertia. This unintended behavior could not be explained immediately. Finally, structural damping in the four whip-like antennas was made responsible for the flip (explained here).

The flip can be reproduced with MapleSim using flexible beam components with damping enabled. Without damping and without slight angular misalignment at launch the flip does not manifest.

The simulation is only of qualitative nature since data of the antennas could not be found. On images of Explorer 1, the antennas look prebend and show large deflections of about 45 degrees under gravity. Since rotation of the satelite stretches the antennas, no modeling of large deflections needed to be considered in the simulation and rather stiff antennas (2 mm in diameter) without spheres at their ends were used. (Modeling large deflections with high fidelity might only be considered if the unfolding process of the antennas at launch is of interest. This should be modeled with several flexible beam components.)  

The graph bellow shows the evolution of the angular velocity in x direction. Conservation of angular momentum reduces the angular velocity when the satellite starts flipping towards a rotation about the axis of maximum moment of inertia.

Not long ago such simulations would have been worth a doctoral thesis. Today its rather straight forward to reproduce the flip with MapleSim.

Not so easy is the calculation of energy and angular momentum (for the purpose of observing how well numerics preserve physical quantities in rather long calculations. After all, the solver does not know the physical context). Such calculations would require access to the inertia matrix of the cylinder component including a coordinate transform into the frame of reference where the vector of rotation can be measured.

In case such calculations are possible with MapleSim, it would be nice if someone can update the model or at least indicate how calculations can be done.

Explorer_1_Parameters_and_links.mw

Explorer_1.msim

On a side note: I learned from the flip in an excellent series of lectures on dynamics. Wherever our professor could, he came up with animation in hardware. In this case, he could only provide an exciting story about the space race and sometimes fruitful mistakes in science. That’s why I still remember it.

Dear all,

The November issue of Maple Transactions is now up (we will be adding a few more items to that issue over the course of the month).  See https://mapletransactions.org/index.php/maple/index for the articles.

More importantly, Maple Primes seems to have a great many interesting posts, some of which could well be worked up into a paper (or a video).  Maple Transactions accepts worksheets (documents, workbooks) for publication, as well, although we want a high standard of readability for that.  I invite you to contribute.

The next issue of Maple Transactions will be the Special Issue that is the Proceedings of the Maple Conference 2021 (see my previous post :)

-r


As a student I came across an amazing lab experimentA T-type structure with two masses attached to it showed a sudden change in oscillation mode.  


With MapleSim I was able to reproduce the experiment.

At the time I was told that this perplexing phenome happens because there are always imperfections. 


Today we would probably say that the symmetry has to be broken. The attached example has two parameter sets that a) break symmetry of boundary conditions and b) by structural asymmetry (i.e imperfection). Asymmetry in the initial conditions should also be possible (but I could make work with flexible beams). 

Compared to coupled oscillators that exchange energy via a coupling spring, this example exchanges energy via masses. In fact in its simplest implementation only one mass and two elastic structures are required for this type of mode coupling. MapleSim multibody library offers plenty of possibilities to demonstrate thisFlexible beams are not required. However, flexible beams show mode coupling beautifully and allow a simple reproduction in real life. For that the worksheet contains a parameter set to build a real model with steel wires. Tuning by adjusting the length of the vertical post is required since nonlinearities already shift frequencies in the model. 


I would be interested in other cool examples of mode coupling. I am also interested in solutions for flexible beams that impose asymmetry in the initial conditions. To keep it realistic at the start, the T should be bend as one would bend it with a fingertip in x direction. It would be even more realistic if the arms are flexed by gravity with zero velocity at the start of the simulation. How can this be done? 


Flexible_beam_mode_coupling.msim

Hi everyone! It's been a remarkably long time since I posted on MaplePrimes -- I should probably briefly reintroduce myself to the community here. My name is Erik Postma. I manage the mathematical software group at Maplesoft: the team that writes most of the Maple-language code in the Maple product, also known as the math library. You can find a longer introduction at this link.

One of my tasks at Maplesoft is the following. When a request for tech support comes in, our tech support team can usually answer the request by themselves. But no single person can know everything, and when specialized knowledge of Maple's mathematical library is needed, they ask my team for help. I screen such requests, answer what I can by myself, and send the even more specialized requests to the experts responsible for the appropriate part of the library.

Yesterday I received a request from a user asking how to unwrap angles occurring in an expression. This is the general idea of taking the fact that sin(phi) = 'sin'(phi + 2*Pi), and similarly for the other trig functions; and using it to modify an expression of the form sin(phi) to make it look "nicer" by adding or subtracting a multiple of 2*Pi to the angle. For a constant, real value of phi you would simply make the result be as close to 0 as possible; this is discussed in e.g. this MaplePrimes question, but the expressions that this user was interested in had arguments for the trig functions that involved variables, too.

In such cases, the easiest solution is usually to write a small piece of custom code that the user can use. You might think that we should just add all these bits and pieces to the Maple product, so that everyone can use them -- but there are several reasons why that's not usually a good idea:

  • Such code is often too specialized for general use.
  • Sometimes it is reliable enough to use if we can communicate a particular caveat to the user -- "this will not work if condition XYZ occurs" -- but if it's part of the Maple library, an unsuspecting user might try it under condition XYZ and maybe get a wrong answer.
  • This type of code code generally doesn't undergo the careful interface design, the testing process, and the documentation effort that we apply to the code that we ship as part of the product; to bring it up to the standards required for shipping it as part of Maple might increase the time spent from, say, 15 minutes, to several days.

That said, I thought this case was interesting enough to post on MaplePrimes, so that the community can take a look - maybe there is something here that can help you with your own code.

So here is the concrete question from the user. They have expressions coming from an inverse Laplace transform, such as:

with(inttrans):
F := -0.3000*(-1 + exp(-s))*s/(0.0500*s^2 + 0.1*s + 125);
f := invlaplace(F, s, t)*u(t);
# result: (.1680672269e-1*exp(1.-1.*t)*Heaviside(t-1.)*(7.141428429*sin(49.98999900*t-
#         49.98999900)-357.*cos(49.98999900*t-49.98999900))+.1680672269e-1*(-7.141428429*sin
#         (49.98999900*t)+357.*cos(49.98999900*t))*exp(-1.*t))*u(t)

I interpreted their request for unwrapping these angles as replacing the expressions of the form sin(c1 * t + c0) with versions where the constant term was unwrapped. Thinking a bit about how to be safe if unexpected expressions show up, I came up with the following solution:

unwrap_trig_functions := module()
local ModuleApply := proc(expr :: algebraic, $)
  return evalindets(expr, ':-trig', process_trig);
end proc;

local process_trig := proc(expr :: trig, $)
  local terms := convert(op(expr), ':-list', ':-`+`');
  local const, nonconst;
  const, nonconst := selectremove(type, terms, ':-complexcons');
  const := add(const);
  local result := add(nonconst) + (
    if is(const = 0) then
      0;
    else
      const := evalf(const);
      if type(const, ':-float') then
        frem(const, 2.*Pi);
      else
        frem(Re(const), 2.*Pi) + I*Im(const);
      end if;
    end if);
  return op(0, expr)(result);
end proc;
end module;

# To use this, with f defined as above:
f2 := unwrap_trig_functions(f);
# result: (.1680672269e-1*exp(1.-1.*t)*Heaviside(t-1.)*(7.141428429*sin(49.98999900*t+
#         .27548346)-357.*cos(49.98999900*t+.27548346))+.1680672269e-1*(-7.141428429*sin(
#         49.98999900*t)+357.*cos(49.98999900*t))*exp(-1.*t))*u(t)

Exercise for the reader, in case you expect to encounter very large constant terms: replace the calls to frem above with the code that Alec Mihailovs wrote in the question linked above!

This research work demonstrates the use of the MapleSim and Python scientific packages for the correct use of differential equations for engineering students, in the face of the pandemic generated by COVID-19. The main objective is to visualize the teaching and learning process of the subject presented. The methodology used is block diagrams using graphic programming and the one-dimensional symbolic structure. The results are totally optimal since automation was achieved in the differential equations applied to different engineering cases. The applications generated by the scientific software are fully upgradeable and available in the cloud.

Ponencia_CIMAC_2021.pdf

Lenin AC

Ambassador Maple

Using Python and MapleSim versus Basic Science Teaching in Times of Pandemic

Abastract

In the following research work entitled Use of Python and MapleSim against the teaching of Basic Sciences in times of pandemic, due to the social immobility imposed by the government, we saw the need to use scientific software to train our students with modern approaches. The purpose is to raise the learning achievement in the subjects of Mathematics and Physics for engineering. The methodology we used was native syntax programming and graphic component programming. The results that we obtained in modeling and simulation are quite exact, with respect to the traditional results. Finally, all the material can be updated and managed at any time because it is available on maplecloud.

Keywords: Python, MapleSim, modeling, simulation

Ponencia_UNTumbes.pdf

Lenin AC

Ambassador Maple

Hi Mapleprimes,

Per your request.

A_prime_producing_quadratic_expression_2019_(2).pdf

bye

In the present work we are going to demonstrate the importance of the study of vector analysis, with modeling and simulation criteria, using the MapleSim scientific software from MapleSoft. Nowadays, the majority of higher education centers direct their teaching of vector analysis in an abstract way and there are few or no teachers who carry out applications using modeling and simulation. (In spanish)

IPN_CICATA_2020.pdf

Expo_MapleSim_CICATA.zip


Playing mini-golf recently, I realized that my protractor can only help me so far since it can't calculate the speed of the swing needed.  I decided a more sophisticated tool was needed and modeled a trick-shot in MapleSim.

To start, I laid out the obstacles, the ball and club, the ground, and some additional visualizations in the MapleSim environment.


When running the simulation, my first result wasn't even close to the hole (similar to when I play in real life!).


The model clearly needed to be optimized. I went to the Optimization app in MapleSim (this can be found under Add Apps or Templates  on the left hand side).


Inside the app I clicked "Load System" then selected the parameters I wanted to optimize.


For this case, I'm optimizing 's' (the speed of the club) and 'theta' (the angle of the club). For the Objective Function I added a Relative Translation Sensor to the model and attached a probe to the Vector Norm of the output.


Inside the app, I switched to the Objective Function section.  Selecting Probes, I added the new probe as the Objective Function by giving it a weight of 1.


Scrolling down to "Execute Parameter Optimization", I checked the "Use Global Optimization Toolbox" checkbox, and clicked Run Parameter Optimization.


Following a run time of 120 seconds, the app returns the graph of the objective function. 


Below the plot, optimal values for the parameters are given. Plugging these back into the parameter block for the simulation we see that the ball does in fact go into the hole. Success!


Mini_golf_Global_Optimization.msim

Application of MapleSim in Science and Engineering: a simulationbased approach

In this research work I show the methods of embedded components together with modeling and simulation carried out with Maple and MapleSim for the main areas of science and engineering (mathematics, physics, civil, mechanical etc); These two latest scientific softwares belonging to the company Maplesoft. Designed to be generated and used by teachers of education, as well as by university teachers and engineers; the results are highly optimal since the times saved in calculations are invested in analyzes and interpretations; among other benefits; in this way we can use our applications in the cloud since web technology supports Maple code with procedural and component syntax.

FAST_UNT_2020.pdf

kinematics_curvilinear_updated_2020.mw

Lenin AC

Ambassador of Maple

Application developed using Maple and MapleSim. You can observe the vector analysis using Maple and the simulation using MapleSim. Also included a video of the result. It is a simple structure. A pole fastened by two cables and a force applied to the top. The results are to calculate tensions one and two. Consider the mass of each rope. In spanish.

POSTE_PARADO.zip

Lenin Araujo Castillo

Ambassador of Maple


Analysis in Dynamics of Structures with Maplesim for Engineering
Here is the power of Maplesim in modeling and simulation. With Maplesim you can model structures at rest and dynamics. Considering real patterns of our world for better optimization.Project developed for students of Civil Engineering, Architecture, Mechatronics and all those professional careers related to structures.

CIMAC_UNALM_2019.pdf

Lenin Araujo Castillo

Ambassador of Maple

1 2 3 Page 1 of 3